Evergold's Golden Lion Property in B.C. Returns High Grades to 14.95 g/t Gold in Sequential Soil Samples, and 13,406 g/t Silver and 15.9% Copper in Selected Rock Samples, Underscoring Near Term Discovery Potential
Toronto, Ontario – February 10, 2020 – Evergold Corp. (TSXV: EVER) (“Evergold” or the “Company”), is pleased to announce that a limited program of rock and soil sampling conducted last summer at the GL1 and GL2 target areas on its wholly-owned Golden Lion property in northwest B.C. has returned very strong results, including highs to 14.95 g/t gold in sequential soil samples, and 13,406 g/t silver and 15.9% copper in selected rock samples. Significant assay results are presented in Tables 1 through 6, and Figures 2 through 4. Readers should note that rock grab samples are by their nature selective and not necessarily representative of the mineralization hosted on the property.
The program was carried out during the run-up to the Company’s October 4, 2019, $3.45 million initial public offering. Although limited in budget and scope, the program was successful in both extending Au-Ag-Cu geochemical anomalies previously defined by the Company and discovering important new ones. The results further highlight the discovery potential at the GL1 and GL2 target areas, which the Company intends to drill in the rapidly approaching 2020 field season.
Highlights:
- High-grade gold in soils, GL1 North Ridge: Ten sequential soil samples taken at approximately 50 metre intervals along the spine of a previously unsampled ridge (now designated ‘GL1 North Ridge’) roughly 1 km north of the GL1 Core Area, returned a 300 metre-long string of very strongly anomalous gold and copper values with peaks of 14,950 ppb (14.95 g/t) Au and 1.59% Cu (Figures 2, 3 and 4, and Table 1). The average values (uncut) of the six sequential samples that appear to define the core of the anomaly were 3,328 ppb Au, 2.8 ppm Ag, and 4,422 ppm Cu; the median values were 694 ppb Au, 1.1 ppm Ag, and 2,129 ppm Cu. The industry generally considers soil samples assaying greater than 50 ppb (0.05 g/t) Au noteworthy;
- High-grade silver in rock, GL1 Core Area: Three rock samples taken adjacent to the historical GL1 sample grid returned strong values of silver to a high of 13,406 ppm (13,406 g/t) Ag (Figure 3, and Table 2). The average value was 5,812 ppm Ag; the median value was 2,130 ppm Ag;
- Strong copper, gold and silver in intensely mineralized stockwork, GL2 Ridge East: Near the eastern end of GL2 Ridge, nine rock samples (chip, grab and float) collected from a newly discovered 250 metre-long trend of densely veined quartz stockwork hosted by intrusive rocks returned highs to 3.26% Cu, 4.33 g/t Au and 22.4 g/t Ag (Figures 2, 3 and 4, and Table 3). The average values of these nine samples were 0.89% Cu, 0.97 g/t Au and 7.3 g/t Ag; the median values were 0.38% Cu, 0.002 g/t Au and 2.3 g/t Ag;
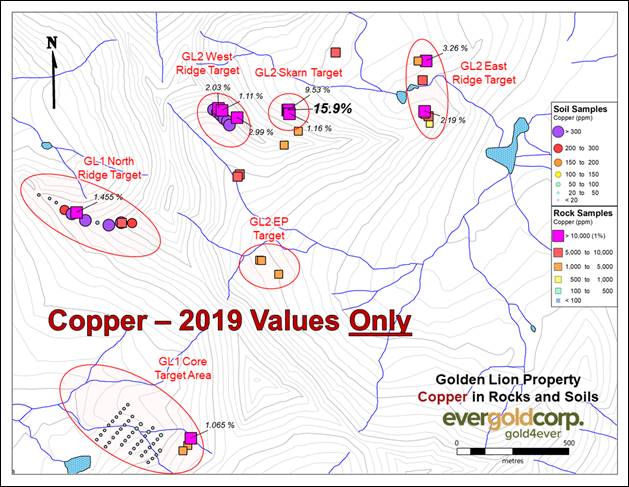
- High-grade copper +/- gold +/- silver at the GL2 Skarn target: Five new grab samples taken from the GL2 Skarn target (Figures 2, 3 and 4, and Table 4), discovered in 2018, returned results consistent with previous sampling, with assays up to 15.9% Cu, 40.0 g/t Ag, and 1.54 g/t Au. The average values of these five samples were 5.43% Cu, 0.46 g/t Au and 21.2 g/t Ag; the median values were 1.16% Cu, 0.22 g/t Au and 23.2 g/t Ag.
“We continue to feel really good about the discovery prospects at Golden Lion, as each new round of work we do there returns strong results,” said Kevin M. Keough, President & CEO. “We know, from our observations and sampling, that Golden Lion hosts very high-grade gold-silver epithermal style mineralization, high-grade copper-gold-silver skarn, and disseminated porphyry-style copper-gold-silver.The broad area encompassed by these multiple targets suggests the presence of one or more intrusive systems of significant scale.For these reasons we are really looking forward to the upcoming field season and drill-testing these exciting targets.”
Table 1: GL1 North Ridge Target - Soil and Rock Results for Gold, Silver and Copper (See Figures 2, 3, and 4 for location of sample sites. Values are uncut and numbers are rounded. Readers should note that rock grab samples are by their nature selective, and are not necessarily representative of the mineralization hosted on the property.)
| SOIL Sample ID | Soil Sample Medium |
Gold (ppb) |
Silver (ppm) |
Copper (ppm) |
| GLAA19D-050 | B-Horizon | 128 | 0.1 | 223 |
| GLAA19D-051 | B-Horizon | 3,490 | 4.3 | 15,950 |
| GLAA19D-052 | B-Horizon | 14,950 | 10.1 | 6,060 |
| GLAA19D-053 | B-Horizon | 11 | 0.3 | 40 |
| GLAA19D-054 | B-Horizon | 232 | 0.6 | 428 |
| GLAA19D-055 | B-Horizon | 1,155 | 1.5 | 3,830 |
| Average Zone Value | 3,328 | 2.8 | 4,422 | |
| Median Zone Value | 694 | 1.1 | 2,129 | |
| ROCK Sample ID | Rock Sample Type |
Gold (ppm) |
Silver (ppm) |
Copper (%) |
| Y738460 | float | 1.82 | 21.6 | 1.46 |
| Y738461 | chip | 0.01 | 3.6 | 0.63 |
Table 2: GL1 Core Area Target - Rock Results for Gold, Silver and Copper
(See Figures 2, 3 and 4 for location of sample sites. Values are uncut and numbers are rounded. Readers should note that rock grab samples are by their nature selective, and are not necessarily representative of the mineralization hosted on the property.)
| ROCK Sample ID | Rock Sample Type |
Gold (ppm) |
Silver (ppm) |
Copper (%) |
| Y738457 | grab | 0.003 | 1,900 | 0.16 |
| Y738458 | grab | 0.088 | 13,406 | 1.07 |
| Y738459 | grab | 0.009 | 2,130 | 0.26 |
| Average Zone Value | 0.033 | 5,812 | 0.49 | |
| Median Zone Value | 0.009 | 2,130 | 0.26 |
Table 3: GL2 East Ridge Target - Rock Results for Gold, Silver and Copper
(See Figures 2, 3, and 4 for location of sample sites. Values are uncut and numbers are rounded. Readers should note that rock grab samples are by their nature selective, and are not necessarily representative of the mineralization hosted on the property.)
| ROCK Sample ID | Rock Sample Type |
Gold (ppm) |
Silver (ppm) |
Copper (%) |
| Y738285 | grab | 0.001 | 0.1 | 0.06 |
| Y738286 | grab | 0.002 | 5.1 | 0.53 |
| Y738287 | composite chip | 0.002 | 2.3 | 0.38 |
| Y738288 | grab | 0.079 | 2.0 | 0.35 |
| Y738289 | chip | 1.960 | 10.8 | 2.19 |
| Y738290 | grab | 2.380 | 22.4 | 1.00 |
| Y738291 | grab | 0.001 | 1.1 | 0.13 |
| Y738292 | float | 4.330 | 21.1 | 3.26 |
| Y738293 | composite chip | 0.001 | 0.6 | 0.11 |
| Average Zone Value | 0.973 | 7.3 | 0.89 | |
| Median Zone Value | 0.002 | 2.3 | 0.38 |
Table 4: GL2 Skarn Target - Rock Results for Gold, Silver and Copper
(See Figures 2, 3, and 4 for location of sample sites. Values are uncut and numbers are rounded. Readers should note that rock grab samples are by their nature selective, and are not necessarily representative of the mineralization hosted on the property.)
| ROCK Sample ID | Rock Sample Type |
Gold (ppm) |
Silver (ppm) |
Copper (%) |
| Y738294 | grab | 0.007 | 1.5 | 0.32 |
| Y738298 | grab | 0.465 | 39.1 | 15.90 |
| Y738299 | grab | 1.540 | 40.0 | 9.53 |
| Y738300 | grab | 0.222 | 23.2 | 1.16 |
| Y738451 | subcrop | 0.048 | 2.4 | 0.22 |
| Average Zone Value | 0.456 | 21.2 | 5.43 | |
| Median Zone Value | 0.222 | 23.2 | 1.16 |
Table 5: GL2 West Ridge Target - Talus Fines and Rock Results for Gold, Silver and Copper
(See Figures 2, 3, and 4 for location of sample sites. Values are uncut and numbers are rounded. Readers should note that rock grab samples are by their nature selective, and are not necessarily representative of the mineralization hosted on the property.)
| Talus Fines Sample ID | Sample Medium |
Gold (ppb) |
Silver (ppm) |
Copper (ppm) |
| GLAA19D-001 | Talus Fines | 10 | 0.6 | 0.07 |
| GLAA19D-002 | Talus Fines | 16 | 0.5 | 0.10 |
| GLAA19D-003 | Talus Fines | 43 | 1.1 | 0.12 |
| GLAA19D-004 | Talus Fines | 28 | 0.8 | 0.05 |
| GLAA19D-005 | Talus Fines | 54 | 0.6 | 0.05 |
| GLAA19D-006 | Talus Fines | 550 | 1.9 | 0.06 |
| Average Zone Value | 117 | 0.9 | 749 | |
| Median Zone Value | 36 | 0.7 | 659 | |
| ROCK Sample ID | Rock Sample Type |
Gold (ppm) |
Silver (ppm) |
Copper (%) |
| Y738295 | grab | 0.028 | 14.8 | 2.99 |
| Y738296 | grab | 0.053 | 11.7 | 2.03 |
| Y738297 | grab | 0.027 | 7.3 | 1.11 |
| Y738452 | grab | 0.071 | 1.7 | 0.66 |
| Y738453 | grab | 0.341 | 2.7 | 0.92 |
| Average Zone Value | 0.104 | 7.6 | 1.54 | |
| Median Zone Value | 0.053 | 7.3 | 1.11 |
Table 6: GL2 EP Zone Target - Rock Results for Gold, Silver and Copper
(See Figures 2, 3, and 4 for location of sample sites. Values are uncut and numbers are rounded. Readers should note that rock grab samples are by their nature selective, and are not necessarily representative of the mineralization hosted on the property.)
| ROCK Sample ID | Rock Sample Type |
Gold (ppm) |
Silver (ppm) |
Copper (%) |
| Y738454 | grab | 0.77 | 1.3 | 0.32 |
| Y738455 | grab | 6.38 | 4.0 | 0.39 |
| Y738456 | grab | 2.55 | 1.7 | 0.37 |
| Average Zone Value | 3.23 | 2.3 | 0.36 | |
| Median Zone Value | 2.55 | 1.7 | 0.37 |
Quality Assurance and Quality Control
Andrew J. Mitchell, P.Geo., Vice President, Exploration for Evergold Corp. and a Qualified Person as defined by NI 43-101, has reviewed and approved the technical information in this news release.
Evergold Corp. maintains strict QA/QC protocols for all aspects of its exploration programs. Soil samples were collected along reconnaissance lines at a depth of 10-30 cm using an auger or GeoTul. Approximately 500 grams of B-horizon or talus fine material was collected at each site and placed in individually labeled Kraft paper bags, which were then allowed to dry. Once dry, the samples were packed into plastic poly-bags and then into larger, more durable, sealed woven plastic bags (rice bags) prior to shipment to the ALS Global prep facility in Terrace B.C., where they were further dried, weighed and sieved to minus 180 micron (80 mesh). Samples were then packaged and sent to the ALS Global laboratory in North Vancouver B.C., where 30 grams of each sample were analyzed for gold using fire assay followed by inductively coupled plasma-atomic emission spectroscopy analysis (protocol AU-ICP21), and for 35 elements using an aqua regia digestion and mass spectrometry analysis (protocol ME-ICP41).
Rock samples were collected and placed into pre-labelled poly-bags and then put into larger, more durable rice bags prior to shipment to the ALS Global prep facility in Terrace B.C., where they were crushed to 70% less than 2 millimeters. 250-grams of each sample were then produced by riffle splitting and pulverized to better than 85% passing 75 microns. The fine fractions were then sent to the ALS Global laboratory in North Vancouver B.C., where they were analyzed for gold using fire assay followed by inductively coupled plasma-atomic emission spectroscopy analysis (protocol AU-ICP21), and for 35 elements using aqua regia digestion and mass spectrometry analysis (protocol ME-ICP41). Over-limits for silver were analyzed by fire assay gravimetric finish (protocol Ag-CON01).
The ALS Global laboratory in North Vancouver is ISO 9001:2008 certified, and accredited to ISO / IEC 17025:2005 by the Standards Council of Canada.
About Evergold
Evergold Corp. has been assembled by a team with a record of recent success in British Columbia, combining four 100%-owned properties in prime geological real estate from one of BC’s best-known geologists, C.J. Greig, with seasoned management and a qualified board. The Company’s flagship assets consist of the 3,545 hectare Snoball property, located in the heart of BC’s famed Golden Triangle only 12 kilometres off highway 37, where the Company believes it has located the source of a large, strong gold-silver anomaly up-slope of previous work, and the 5,099 hectare Golden Lion property, located well to the east of Snoball in similar Stikine terrane rocks, at the north end of the Toodoggone region, where multiple strong gold-silver-copper targets have been outlined. The Company intends to carry out the first-ever drilling of selected targets on both properties in the forthcoming 2020 field season.
For additional information, please contact:
| Kevin M. Keough | President and CEO |
| Andrew J. Mitchell | Vice President, Exploration |
| Tel: (613) 622-1916 | Tel: (604) 202-0508 |
| [email protected] | [email protected] |
Neither the TSX Venture Exchange nor its Regulation Services Provider (as that term is defined in the policies of the TSX Venture Exchange) accepts responsibility for the adequacy or accuracy of this release.
Cautionary Statement Regarding Forward-Looking Information:
This news release includes certain "forward-looking statements" under applicable Canadian securities legislation. Forward-looking statements include estimates and statements that describe the Company’s future plans, objectives or goals, including words to the effect that the Company or management expects a stated condition or result to occur. Forward-looking statements may be identified by such terms as “believes”, “anticipates”, “expects”, “estimates”, “may”, “could”, “would”, “will”, or “plan”. Since forward-looking statements are based on assumptions and address future events and conditions, by their very nature they involve inherent risks and uncertainties as disclosed under the heading "Risk Factors" described in the Company’s Prospectus and elsewhere in the Company's filings with Canadian securities regulators. There can be no assurance that such statements will prove to be accurate, as actual results and future events could differ materially from those anticipated in such statements. Accordingly, readers should not place undue reliance on forward-looking statements. The Company disclaims any intention or obligation to update or revise any forward-looking information, whether as a result of new information, future events or otherwise, other than as required by law.
Figure 1: Location of GL1, GL2 and GL3 Target Areas, Golden Lion Property
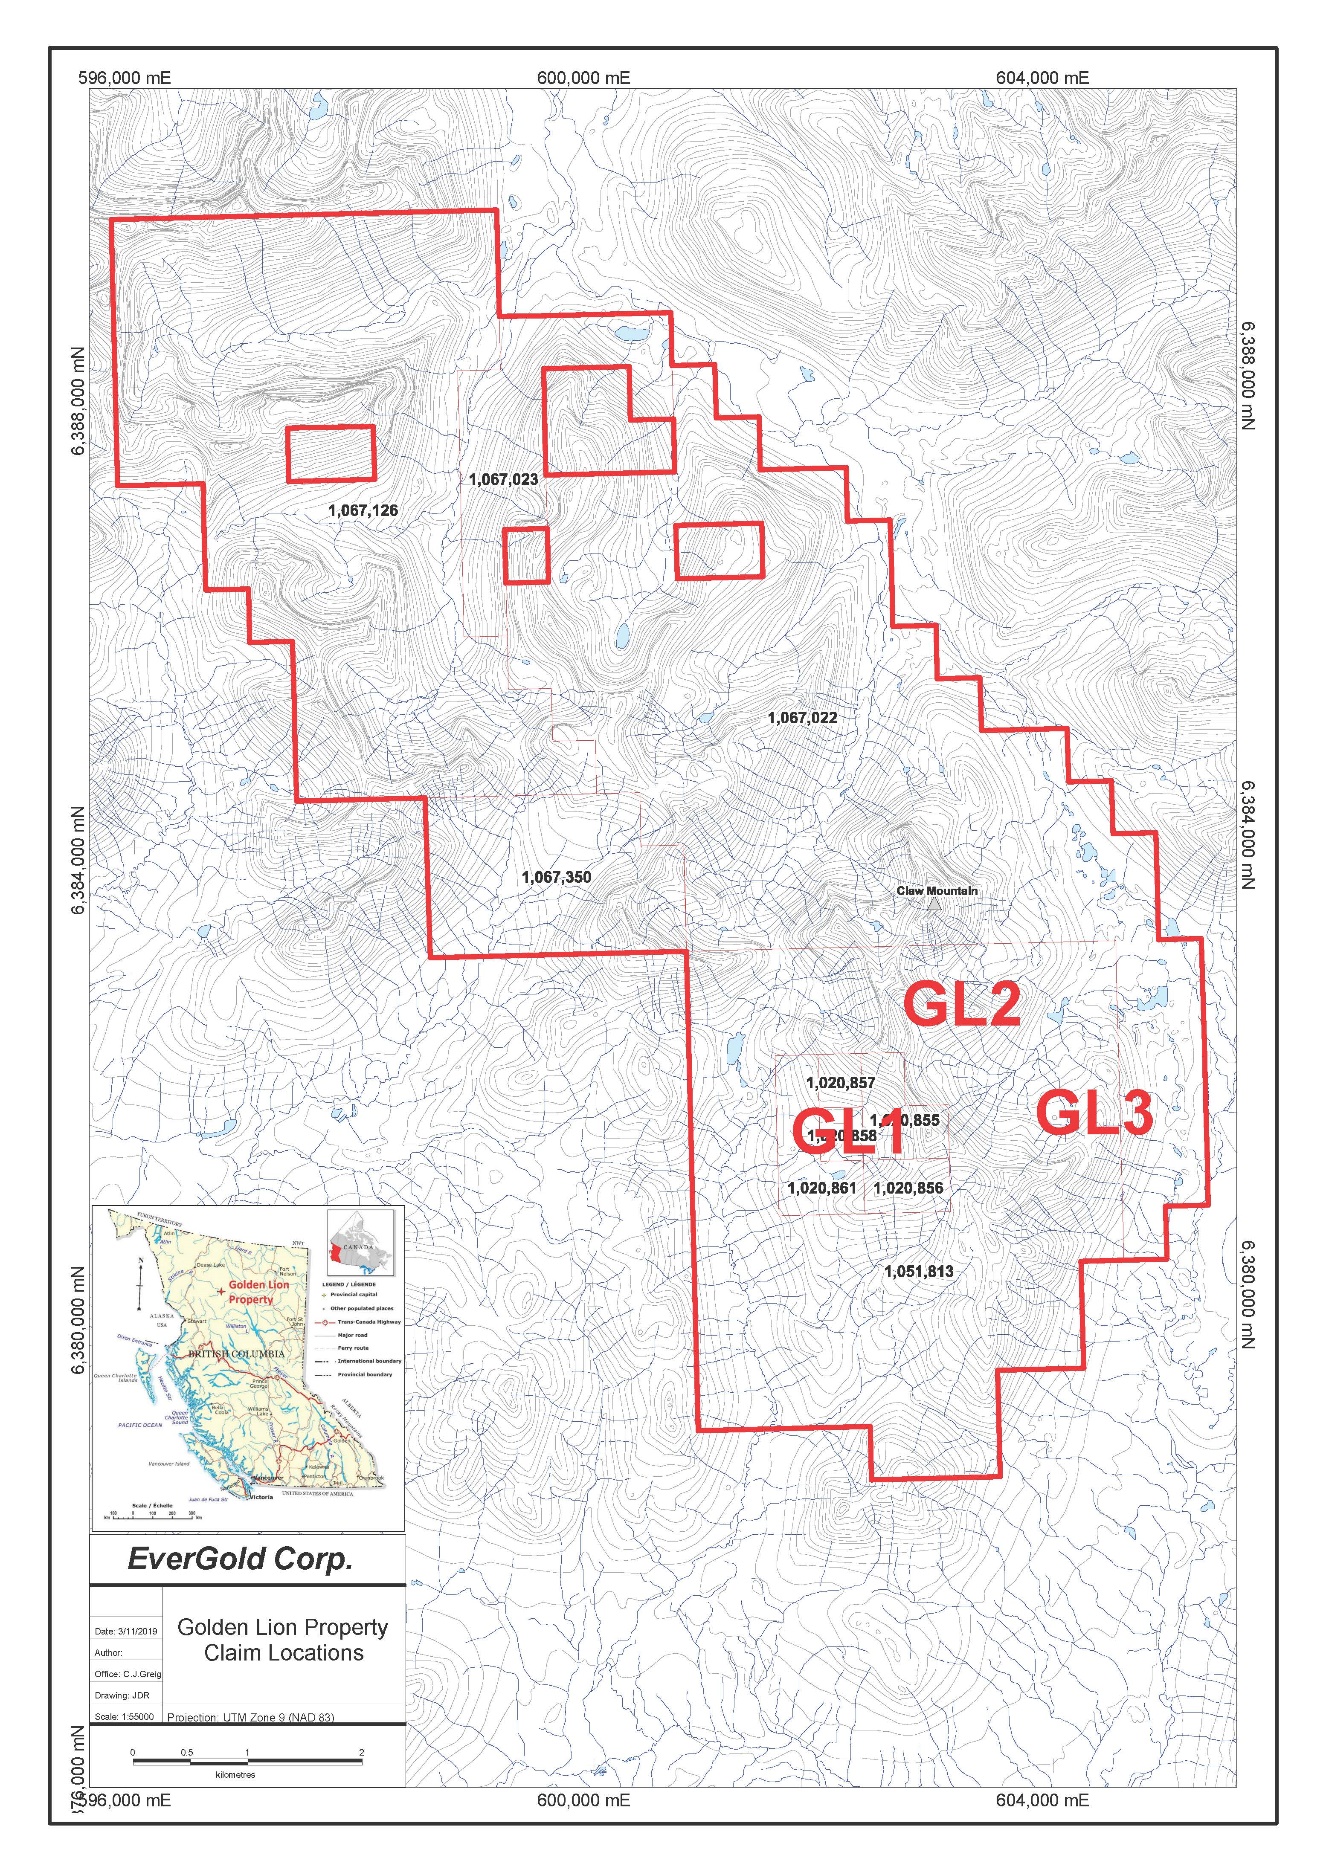
Figure 2: GOLD in Rocks and Soils, Golden Lion Property, 2019 Sample Results Only
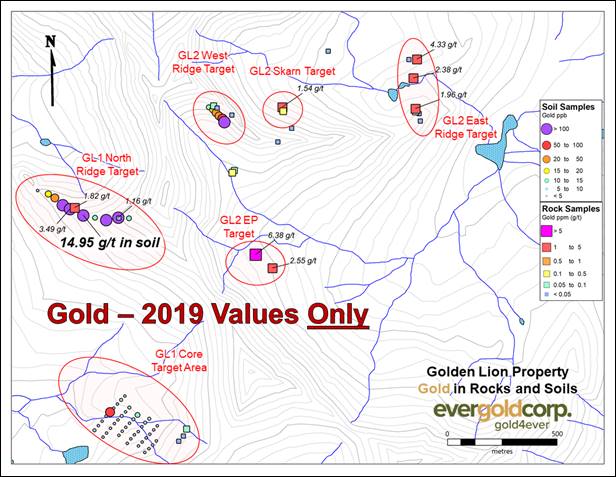
Figure 3: SILVER in Rocks and Soils, Golden Lion Property, 2019 Sample Results Only
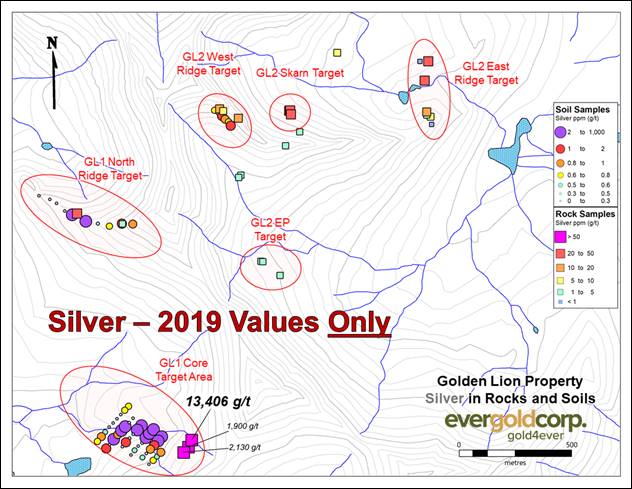
Figure 4: COPPER in Rocks and Soils, Golden Lion Property, 2019 Sample Results Only